People want the room back.
Phones and social media moved more of life onto screens. Now people pay for real nights, real classes and real people. If you can host one, this is your moment.

+45%
More spent on live shows in the US since 20221
Phones took over the day.
Most Americans had a smartphone by 2013. TikTok arrived in 2018. Now nearly half of teens say they are online almost constantly.
91%
Of US adults own a smartphone, up from 35% in 20112
| Year | Questions |
|---|---|
| 2011 | 35 |
| 2012 | 45 |
| 2013 | 58 |
| 2014 | 59 |
| 2015 | 69 |
| 2016 | 77 |
| 2018 | 77 |
| 2019 | 81 |
| 2021 | 85 |
| 2023 | 90 |
| 2024 | 91 |
| 2025 | 91 |
And people saw each other less.
Young adults now spend less than half the time with friends they did in 2010. The steepest one-year drop came right after TikTok arrived.
| Year | Ages 15 to 29 | Everyone |
|---|---|---|
| 2010 | 122 | 62 |
| 2011 | 115 | 61 |
| 2012 | 114 | 60 |
| 2013 | 114 | 61 |
| 2014 | 98 | 56 |
| 2015 | 99 | 54 |
| 2016 | 90 | 52 |
| 2017 | 85 | 48 |
| 2018 | 90 | 47 |
| 2019 | 68 | 39 |
| 2020 | 54 | 26 |
| 2021 | 51 | 27 |
| 2022 | 52 | 29 |
| 2023 | 57 | 29 |
| 2024 | 52 | 30 |
So they went looking for the room.
Since the world reopened in 2022, spending on live shows grew 2.5 times faster than spending overall. People want to be somewhere, with someone.
US spending, 2022 = 1001
| Year | Live shows | Gyms, clubs and sports | Everything | Goods |
|---|---|---|---|---|
| 2015 | 76 | 77 | 70 | 67 |
| 2016 | 82 | 81 | 72 | 68 |
| 2017 | 89 | 85 | 75 | 71 |
| 2018 | 94 | 88 | 79 | 74 |
| 2019 | 100 | 93 | 82 | 76 |
| 2020 | 49 | 66 | 81 | 79 |
| 2021 | 64 | 86 | 91 | 93 |
| 2022 | 100 | 100 | 100 | 100 |
| 2023 | 126 | 114 | 106 | 103 |
| 2024 | 133 | 124 | 112 | 106 |
| 2025 | 145 | 129 | 118 | 109 |
Gadgets got cheaper. Time with a teacher didn't.
Since the iPhone launched in 2007, computer prices fell 67%. Prices for lessons rose 67%.9
| Year | Lessons with a teacher | Concerts and shows | Everything | Computers |
|---|---|---|---|---|
| 2000 | 100 | 100 | 100 | 100 |
| 2001 | 104 | 104 | 103 | 72 |
| 2002 | 108 | 107 | 104 | 54 |
| 2003 | 113 | 113 | 107 | 43 |
| 2004 | 117 | 116 | 110 | 37 |
| 2005 | 121 | 120 | 113 | 31 |
| 2006 | 125 | 124 | 117 | 26 |
| 2007 | 130 | 129 | 120 | 24 |
| 2008 | 135 | 132 | 125 | 21 |
| 2009 | 139 | 134 | 125 | 18 |
| 2010 | 141 | 136 | 127 | 17 |
| 2011 | 143 | 137 | 131 | 15 |
| 2012 | 144 | 140 | 133 | 14 |
| 2013 | 147 | 142 | 135 | 12 |
| 2014 | 149 | 144 | 137 | 11 |
| 2015 | 153 | 147 | 138 | 10 |
| 2016 | 156 | 153 | 139 | 10 |
| 2017 | 161 | 157 | 142 | 9 |
| 2018 | 166 | 160 | 146 | 9 |
| 2019 | 169 | 163 | 148 | 9 |
| 2020 | 172 | 165 | 150 | 8 |
| 2021 | 181 | 170 | 157 | 9 |
| 2022 | 186 | 180 | 170 | 8 |
| 2023 | 204 | 191 | 177 | 8 |
| 2024 | 210 | 198 | 182 | 8 |
| 2025 | 217 | 205 | 187 | 8 |
But hosts don't own the room.
A DJ who wants to throw a night usually goes through people who keep the money, the date and the crowd.
You
You have the talent and the followers
Promoter
Brings a crowd you don't own, and takes a cut
Venue
Picks the date and the production, so every night looks the same
Ticket site
Adds 27% in fees on average10
After
The guests go home as someone else's customers
Firsthand gives you the room.
Turn your followers into members and host experiences only you can give. A chef's two-day class. A DJ's own night.
You
You have the talent and the followers
Members
Your followers join your membership
Experience
You design the night, the class or the weekend, your way
Tickets
Members book. Firsthand keeps 8%, you keep 92%
After
Every guest stays your member for the next one
69%
Of 18 to 35s find events through people they know. Your members are that network.7
What hosts are building
 Rooftop SessionsDJs · from $85
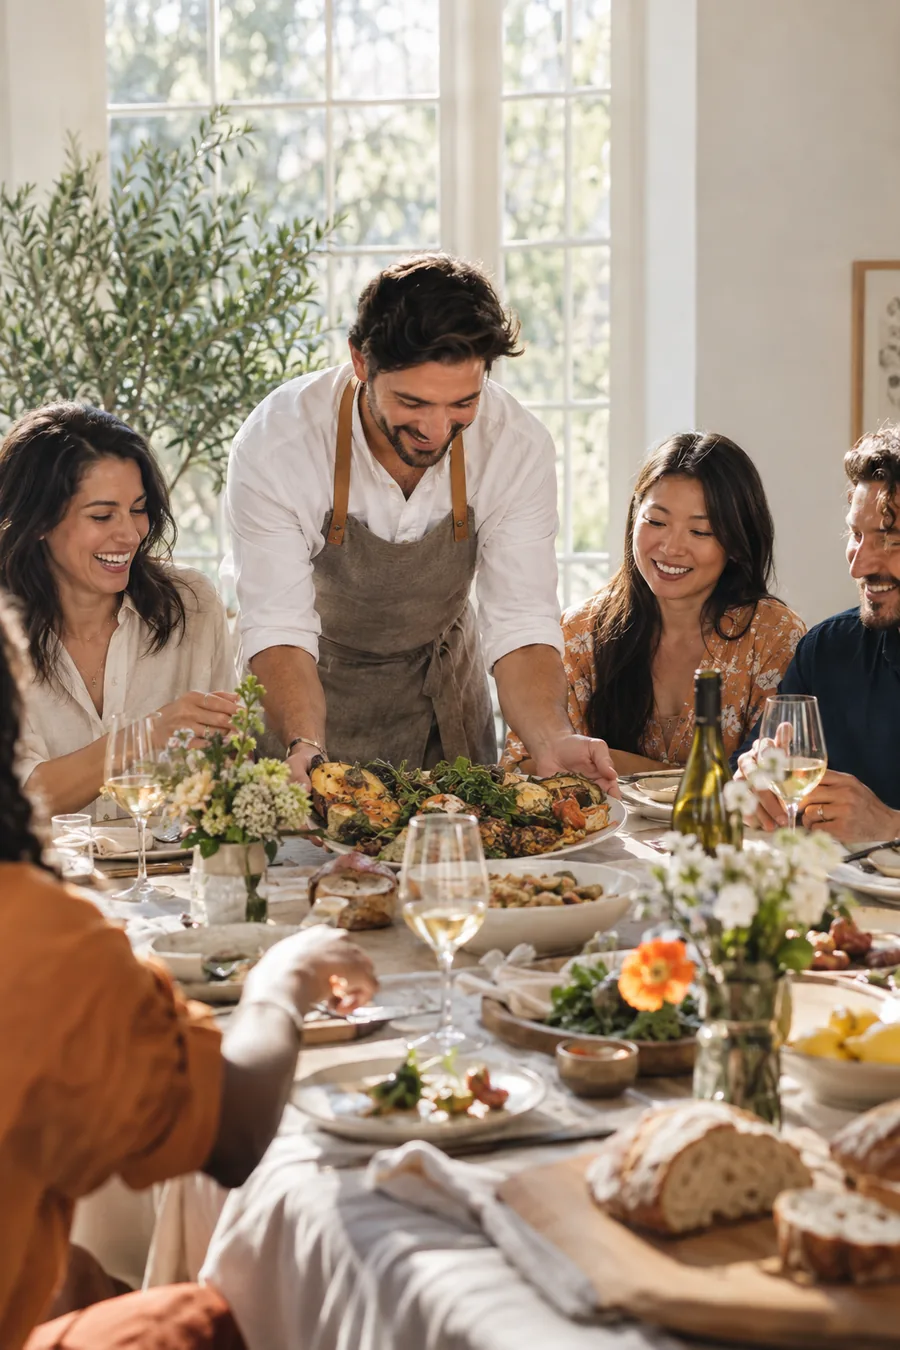 Sunday Supper ClubChefs · from $225
 Jiu-Jitsu CampCoaches · from $1,200
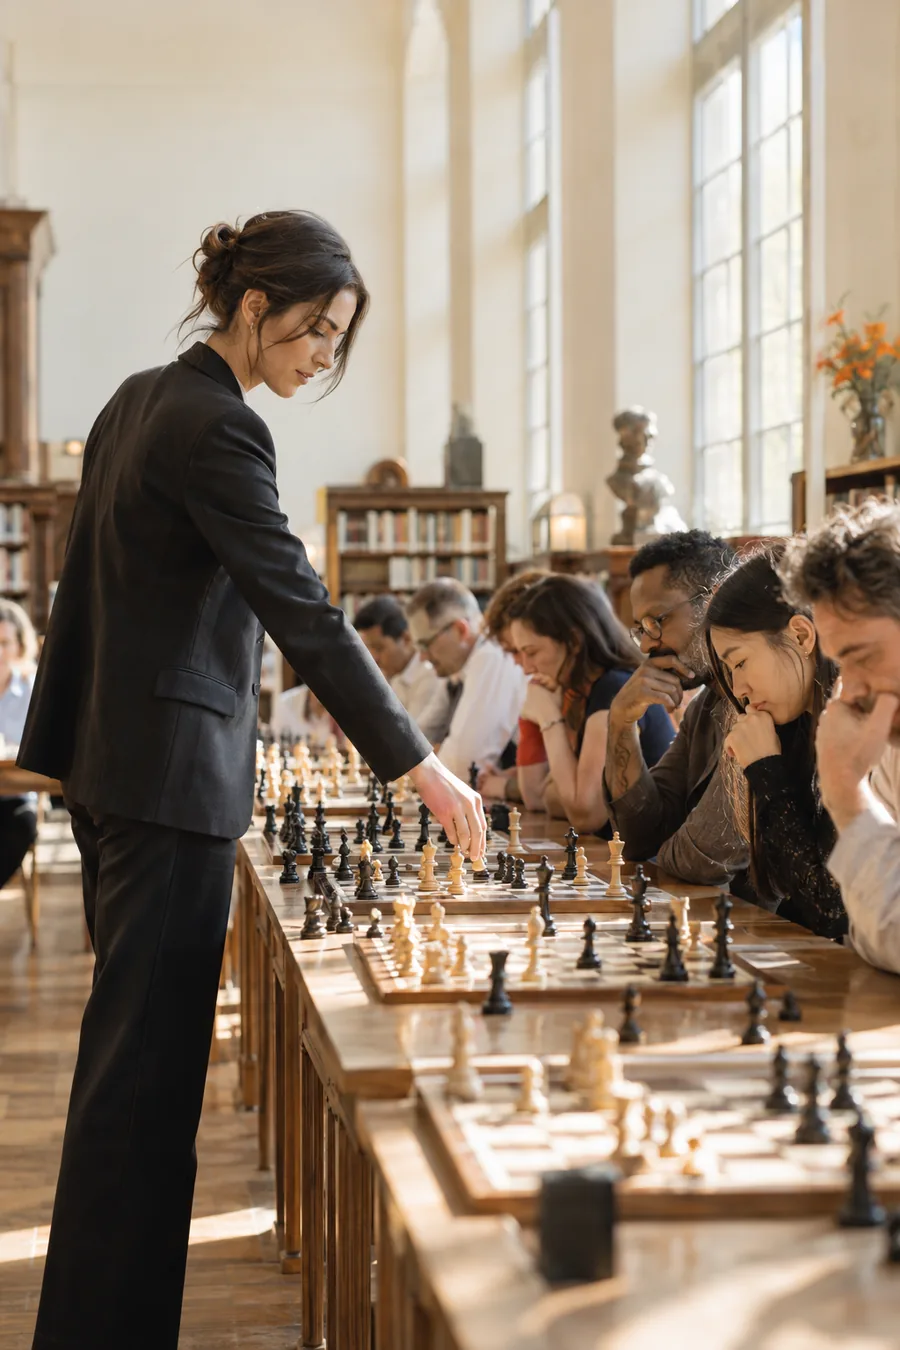 Grandmaster NightChess masters · from $250
 Perfume StudioPerfumers · from $295
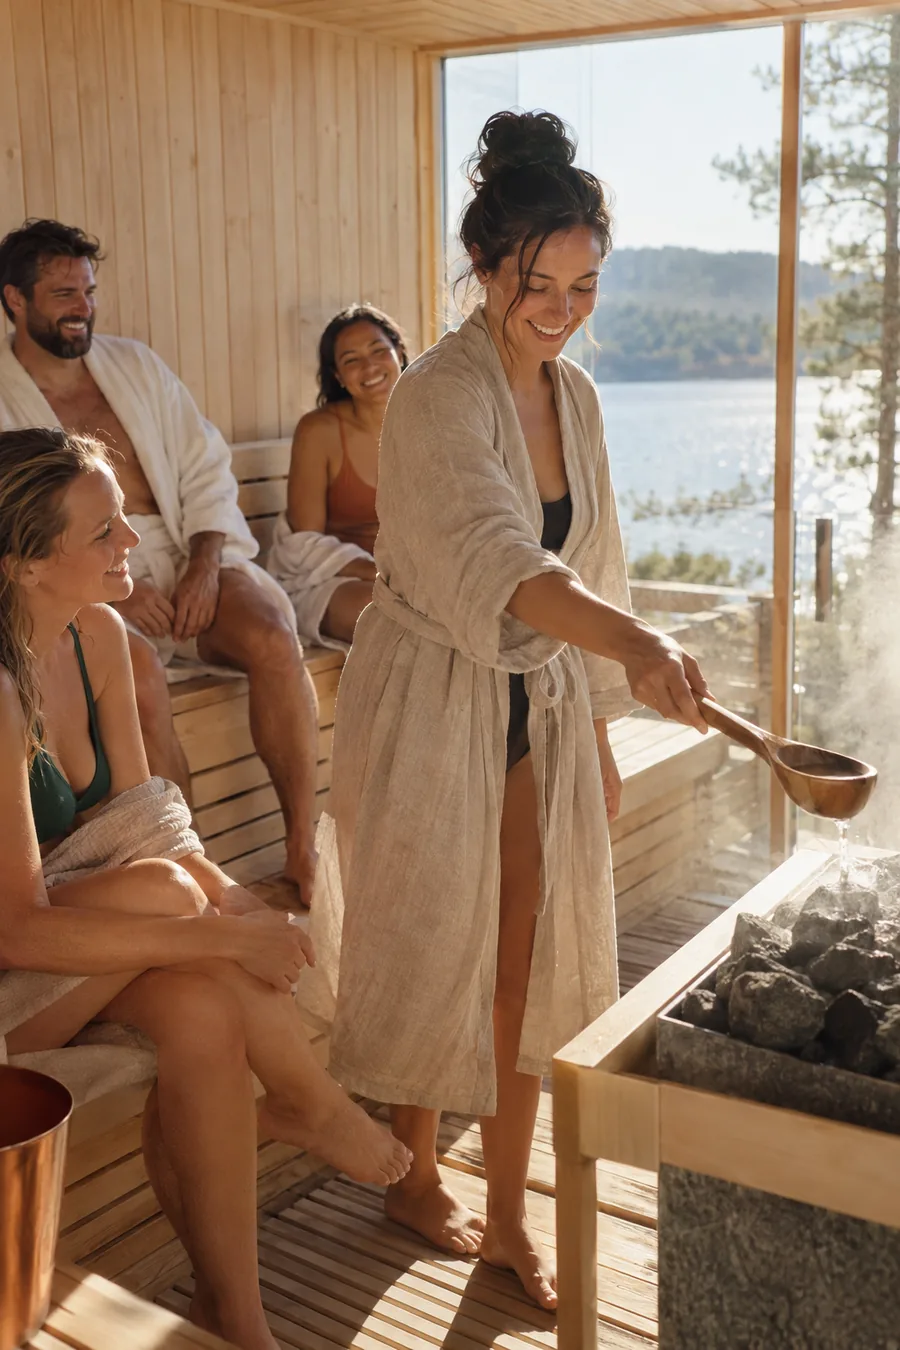 Sunrise Sauna ClubSauna hosts · from $65
The rare thing now is you, in a room.
Sources
- 1US Bureau of Economic Analysis, personal consumption expenditures via FRED, current dollars, 2022 to 2025: live entertainment excluding sports (DLIGRC1A027NBEA), membership clubs and participant sports centers (DMDFRC1A027NBEA), all spending (PCECA), goods (DGDSRC1A027NBEA)
- 2Pew Research Center, Mobile Fact Sheet: share of US adults who own a smartphone, 35% in 2011 to 91% in 2025
- 3TechCrunch, August 2, 2018: Musical.ly merges into TikTok, bringing the app to the US
- 4Pew Research Center, Teens, Social Media and Technology 2024: 46% of US teens are online almost constantly, up from 24% a decade earlier; 16% are on TikTok almost constantly
- 5US Bureau of Labor Statistics, American Time Use Survey, via Our World in Data: time spent with friends, 2010–2024
- 6Gallup, 2025 (2023–2024 data): 25% of US men aged 15 to 34 felt lonely a lot of the previous day, against 18% of all US adults
- 7Eventbrite Social Study, January 2026 (4,051 people aged 18 to 35, US and UK, July 2025): 74% of Gen Z think in-person experiences are more important than digital ones; 79% plan to go to more events in 2026; 69% find events through personal networks and word of mouth
- 8Strava, Year in Sport 2024: running clubs up 59%
- 9US Bureau of Labor Statistics, Consumer Price Index via FRED, annual averages: fees for lessons or instructions (CUUR0000SERF03), admission to movies, theaters and concerts (CUUR0000SS62031), all items (CPIAUCNS), computers and peripherals (CUUR0000SEEE01)
- 10US Government Accountability Office, GAO-18-347: ticket fees averaged 27% (primary) and 31% (resale) of the ticket price